These graphs break down the numbers of enslaved migrants from Virginia in different ways.
“Virginia is the mother of slavery.”
Louis Hughes made this observation in his 1897 autobiography–where he described being sold away from his family in Virginia to Memphis, Tennessee. Virginia in fact represented some 45% of the total number of enslaved African Americans forced to move across state lines between 1790 and 1860: 550,000 from Virginia out of 1.1 million total forced migrants. In early decades Virginia’s share was the clear majority:


Destinations
As the United States seized western and southern lands from Indian nations and opened them up to American settlement, planters, traders, and bankers expanded and shifted the slave market to supply the vast numbers of laborers they demanded to transform forests and swamps into cotton and sugar plantations. This graph indicates the shifting destinations of enslaved African Americans from Virginia. For each decade, the numbers represent Virginia’s “export” divided according to each “import” state’s proportion of the overall slave market:
Tidewater, Piedmont, Valley, West
These graphs represent the shifting participation of each of Virginia’s sub-regions in the slave market. First net numbers, then rates (numbers below 0 represent in-migration to that region):
Subregions
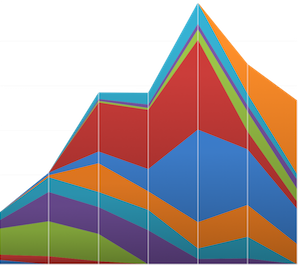
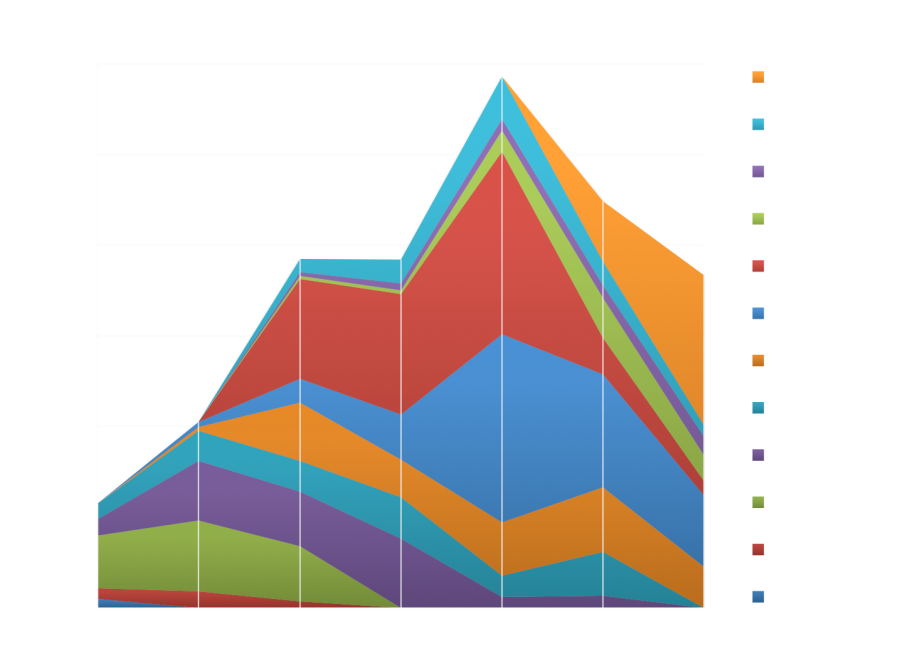
Breaking each sub-region down a bit further, we can see that the northern Tidewater dominated in the early decades, while the southern Piedmont overtook it in the 1830s.
Here’s another way to see it, with each region and subregion shown as a proportion of the whole for each decade:
See Methods.
All graphs copyright 2017 © Phillip Troutman. Unaltered non-commercial use is granted, with acknowledgement. Cite as Phillip Troutman, “Graphing Virginia’s Slave Trade, 1790-1860,” Virginia’s Slave Trade blog, virginiaslavetrade.wordpress.com (your access date).

Hello,
I’m reading your material and just wondering where this slavery thing all began. I have researched my North Carolina family’s history back to a wall where I can’t go any further. I am African American and I have been researching my families for quite sometime now. I have searched for slave documents to gather on-site of detailed information. However much of this information has been kept hidden. I guess my question would be “Do you have names of individual slaves that were traded during this time?” I have connected with many relatives through DNA however we are still trying to figure out how our people where transported to so many different states across America. I’m finding connections to relatives seems like in every state across America. I’m also seeing that that I’m connect to some relatives through both sides of my families via mother and father. Your graphs are very interesting and I’d like to learn more of how you’ve connected each of these states in the south.
LikeLiked by 1 person
Arnold, I’m glad you’re finding this useful for getting some of the big picture. I agree the tracking down names of individuals under slavery is extremely difficult, especially because slaveholders did not often record people’s surnames, or when they did, the surnames African-Americans actually knew themselves by. There are a number of online tools that can help, however. Ancestry.com, for example now includes slave ship manifests coming into New Orleans from the east coast of the US. Marriage records, often included on ancestry.com, will list parents’ names and sometimes birthdates going back into the slavery period. Local court records often include names of slaves. There are many local groups and library ends who can help you with this search. If you haven’t already, I would recommend looking for a local AAGHS: African American Genealogical and Historical Society. They host local meetings and workshops and circulate lists of group members researching different surnames that may connect to some of your people. Best of luck! – Phil
LikeLike
Also, the big picture numbers come from census calculations. I added a methods section that tries to explain that. But more personally, my perspective comes from reading ex-slave autobiographies, in which people narrate their lives as a series of dislocations, sold away from family, sold from person to person, sold from place to place, from Virginia to Kentucky, to Alabama, to Louisiana. Historians have also traced this through plantation records, where the white people are writing back and forth to each other across these spaces, sometimes mentioning slaves or even passing letters written by or dictated by slaves trying to reconnect with people from back home. Abolitionists in the north, both black and white, also published information they learned from fugitives who managed to get out of slavery.
LikeLike